DataLab#
DataLab is an open-source platform for scientific and technical data processing and visualization with unique features designed to meet industrial requirements. Leveraging the richness of the scientific Python ecosystem [1], DataLab serves as a complementary tool for your signal and image processing workflows. It can be extended with your Python code through Plugins or directly from your IDE or your Jupyter notebooks. Go to Installation to get started!
Want to know more?
See our Tutorials –
Try DataLab online, without installation: ![]() .
.
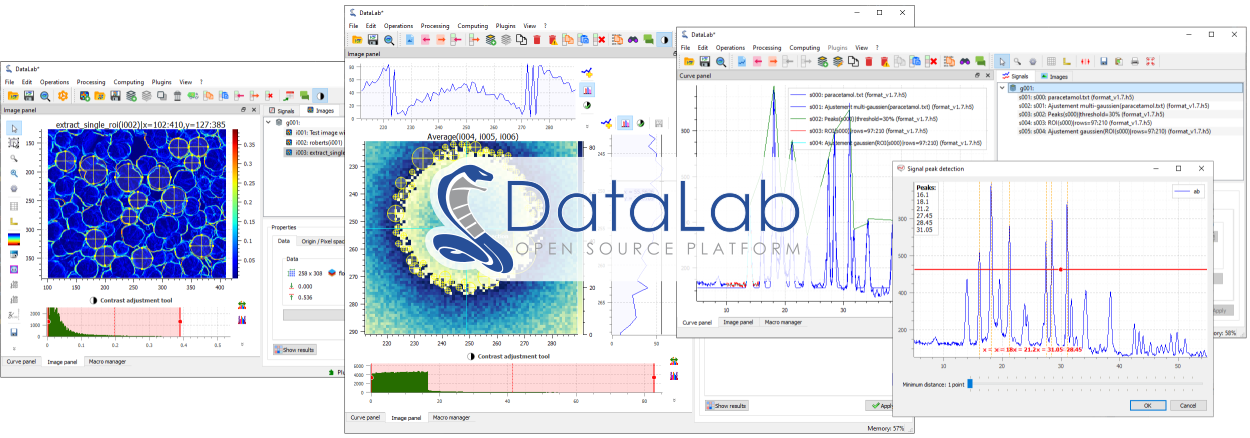
Signal and image visualization in DataLab#
With its user-friendly experience and versatile Usage modes, DataLab enables efficient development of your data processing and visualization applications while benefiting from an industrial-grade technological platform.

DataLab is powered by PlotPyStack, the scientific Python-Qt visualization and graphical user interface stack.#
Footnotes